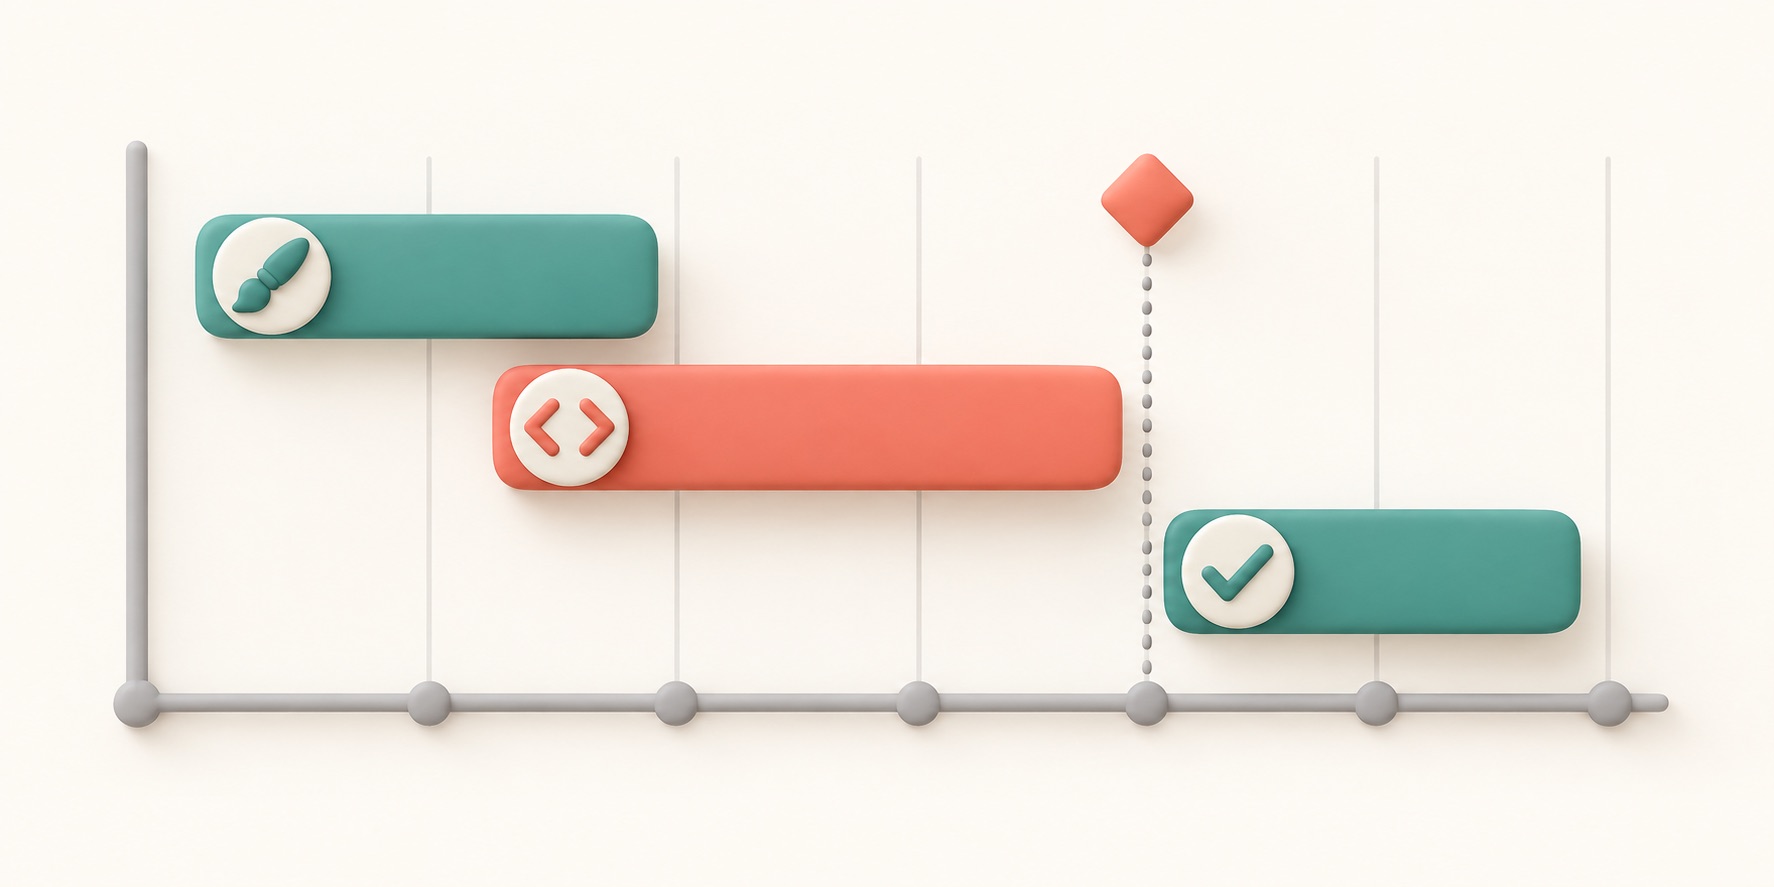
A Gantt chart is a timeline that shows tasks as bars. The bar can show when a task starts, how long it may take, and whether it must wait for another task.
For example, a team might design a new screen, build it, test it, and then release it. If building takes longer, the chart can show that testing and release may also move.
This view is useful when work has several steps that depend on each other. The dates are only as trustworthy as the estimates behind them, so uncertain tasks should not be given made-up precision.